
CCR vs RCR vs OCR | Analysing the Price Gap Between Regions | Singapore Property Market
Introduction
In 2015, the price difference between properties in Singapore’s Core Central Region (CCR) and Outside Central Region (OCR) was massive. For every one property you could purchase in the CCR, you could buy two in the OCR. Fast forward to 2024, and this gap has narrowed significantly—today, the difference is only about 30%. Even more striking is the gap between CCR and the Rest of Central Region (RCR), which is now just 5%.
This raises a key question: Would you still pay the same price to live in the OCR if you could afford to live in the CCR?
Refer to Chart 1
Chart 1: OCR, CCR, RCR Price Difference
The Rise of Decentralization
In the past, living close to town was not just a status symbol—it was a necessity. Proximity to the workplace and essential amenities made the CCR the most practical choice. However, Singapore's government implemented a decentralisation strategy as early as 1991. This long-term urban planning initiative spread employment hubs across the island, bringing jobs closer to where people live.
Today, business nodes like Jurong Lake District, Tampines Regional Centre, Paya Lebar Central, Woodlands Regional Centre, and Punggol Digital District have emerged across Singapore. These areas now boast their own ecosystems—retail, offices, schools, and transport connectivity—challenging the dominance of the CCR as the place to live.
So, does the CCR still hold value? And if so, what drives demand for it now?
Refer to figure 1
Figure 1: Singapore’s Decentralisation Strategy based on the 1991 Concept Plan

Table 2: Average and Median Monthly Househould Employment Income
Rising Incomes, Changing Affordability
To understand demand in the CCR, we need to examine income trends. In 2015, the median household income in Singapore was $8,666. By 2024, that figure has grown to $11,297.
This means that more Singaporeans are now able to consider CCR properties. In 2014, only the top 20% income earners (earning around $2.4M in affordability) could consider the CCR. In 2024, this affordability benchmark has risen to $3.2M, easily placing a CCR 3-bedroom unit within reach.
Even looking at the very highest-income households earning $20,000/month or more, the group has grown by 9% since 2014—equivalent to about 128,000 buyers. If even a fraction of them realise that CCR prices are now comparable to OCR and RCR, a sudden shift in demand to the CCR could occur.
Refer to Table 1
Table 1: Resident Households by Monthly Household Employment
The Quantum Advantage: Getting More for Similar Prices
Take for example Kopar at Newton, a leasehold CCR project completed in 2023. 3-bedroom units range from $2.28M to $3.2M. Compare this with Parc Clematis in the OCR—also completed in 2023—where 3-bedroom units go for $1.76M to $2.8M.
This price similarity was unheard of 10 years ago. Back then, Soleil at Sinaran in the CCR had 3-bedder units transacting at $2.38M to $2.7M, while Trilinq in the OCR launched 3-bedders at just $1.18M to $1.65M—a $1M difference.
Now, you’re paying almost the same for properties in vastly different regions. Why not live more centrally?
Refer to Fig 2, 3, 4, 5


Fig 2. Kopar at Newton

Fig 4. Kopar at Newton

Fig 3. Parc Clematis
What Went Wrong in CCR Properties (And How It’s Being Fixed)
One reason CCR properties struggled to attract buyers in the past was poor product design. Many projects had small site plans, weak layouts, and high inefficiencies.
For example, The Lumos at Leonie Hill had awkward layouts, unusable spaces, and oversized balconies. Its 3-bedder units had consistently unprofitable transactions, with some losses going up to $2.7M.
Additionally, CCR condos used to be filled with tiny one- and two-bedroom units catering to investors, not families. Developments like Loft @ Nathan and Newton Edge had units that families simply couldn’t use.
Recognising these issues, URA changed its stance in 2022. Planning guidelines for CCR now encourage liveable family-sized units with practical layouts. Irwell Hill Residences, launched in 2021, still had 81% 1-2 bedders—but new rules will reduce this proportion in future launches.
Refer to Table 2 and 3
Fig 5. Parc Clematis
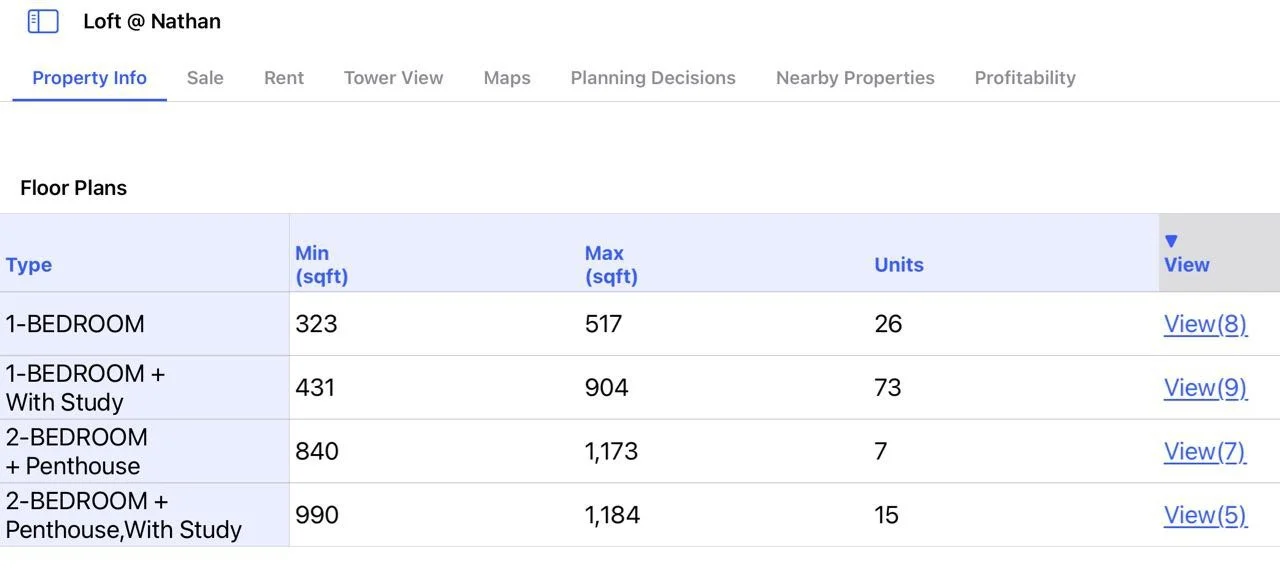

Table 3: Loft @ Nathan
The Freehold Premium & Demand Differences Within CCR
It’s also important to note that CCR properties often come with freehold tenure and larger sizes, contributing to higher quantums. But demand isn’t evenly distributed across CCR. Areas like River Valley and Bukit Timah enjoy stronger organic demand compared to Tanjong Pagar, for example.
Table 2: Newton Edge
CCR Is No Longer Out of Reach
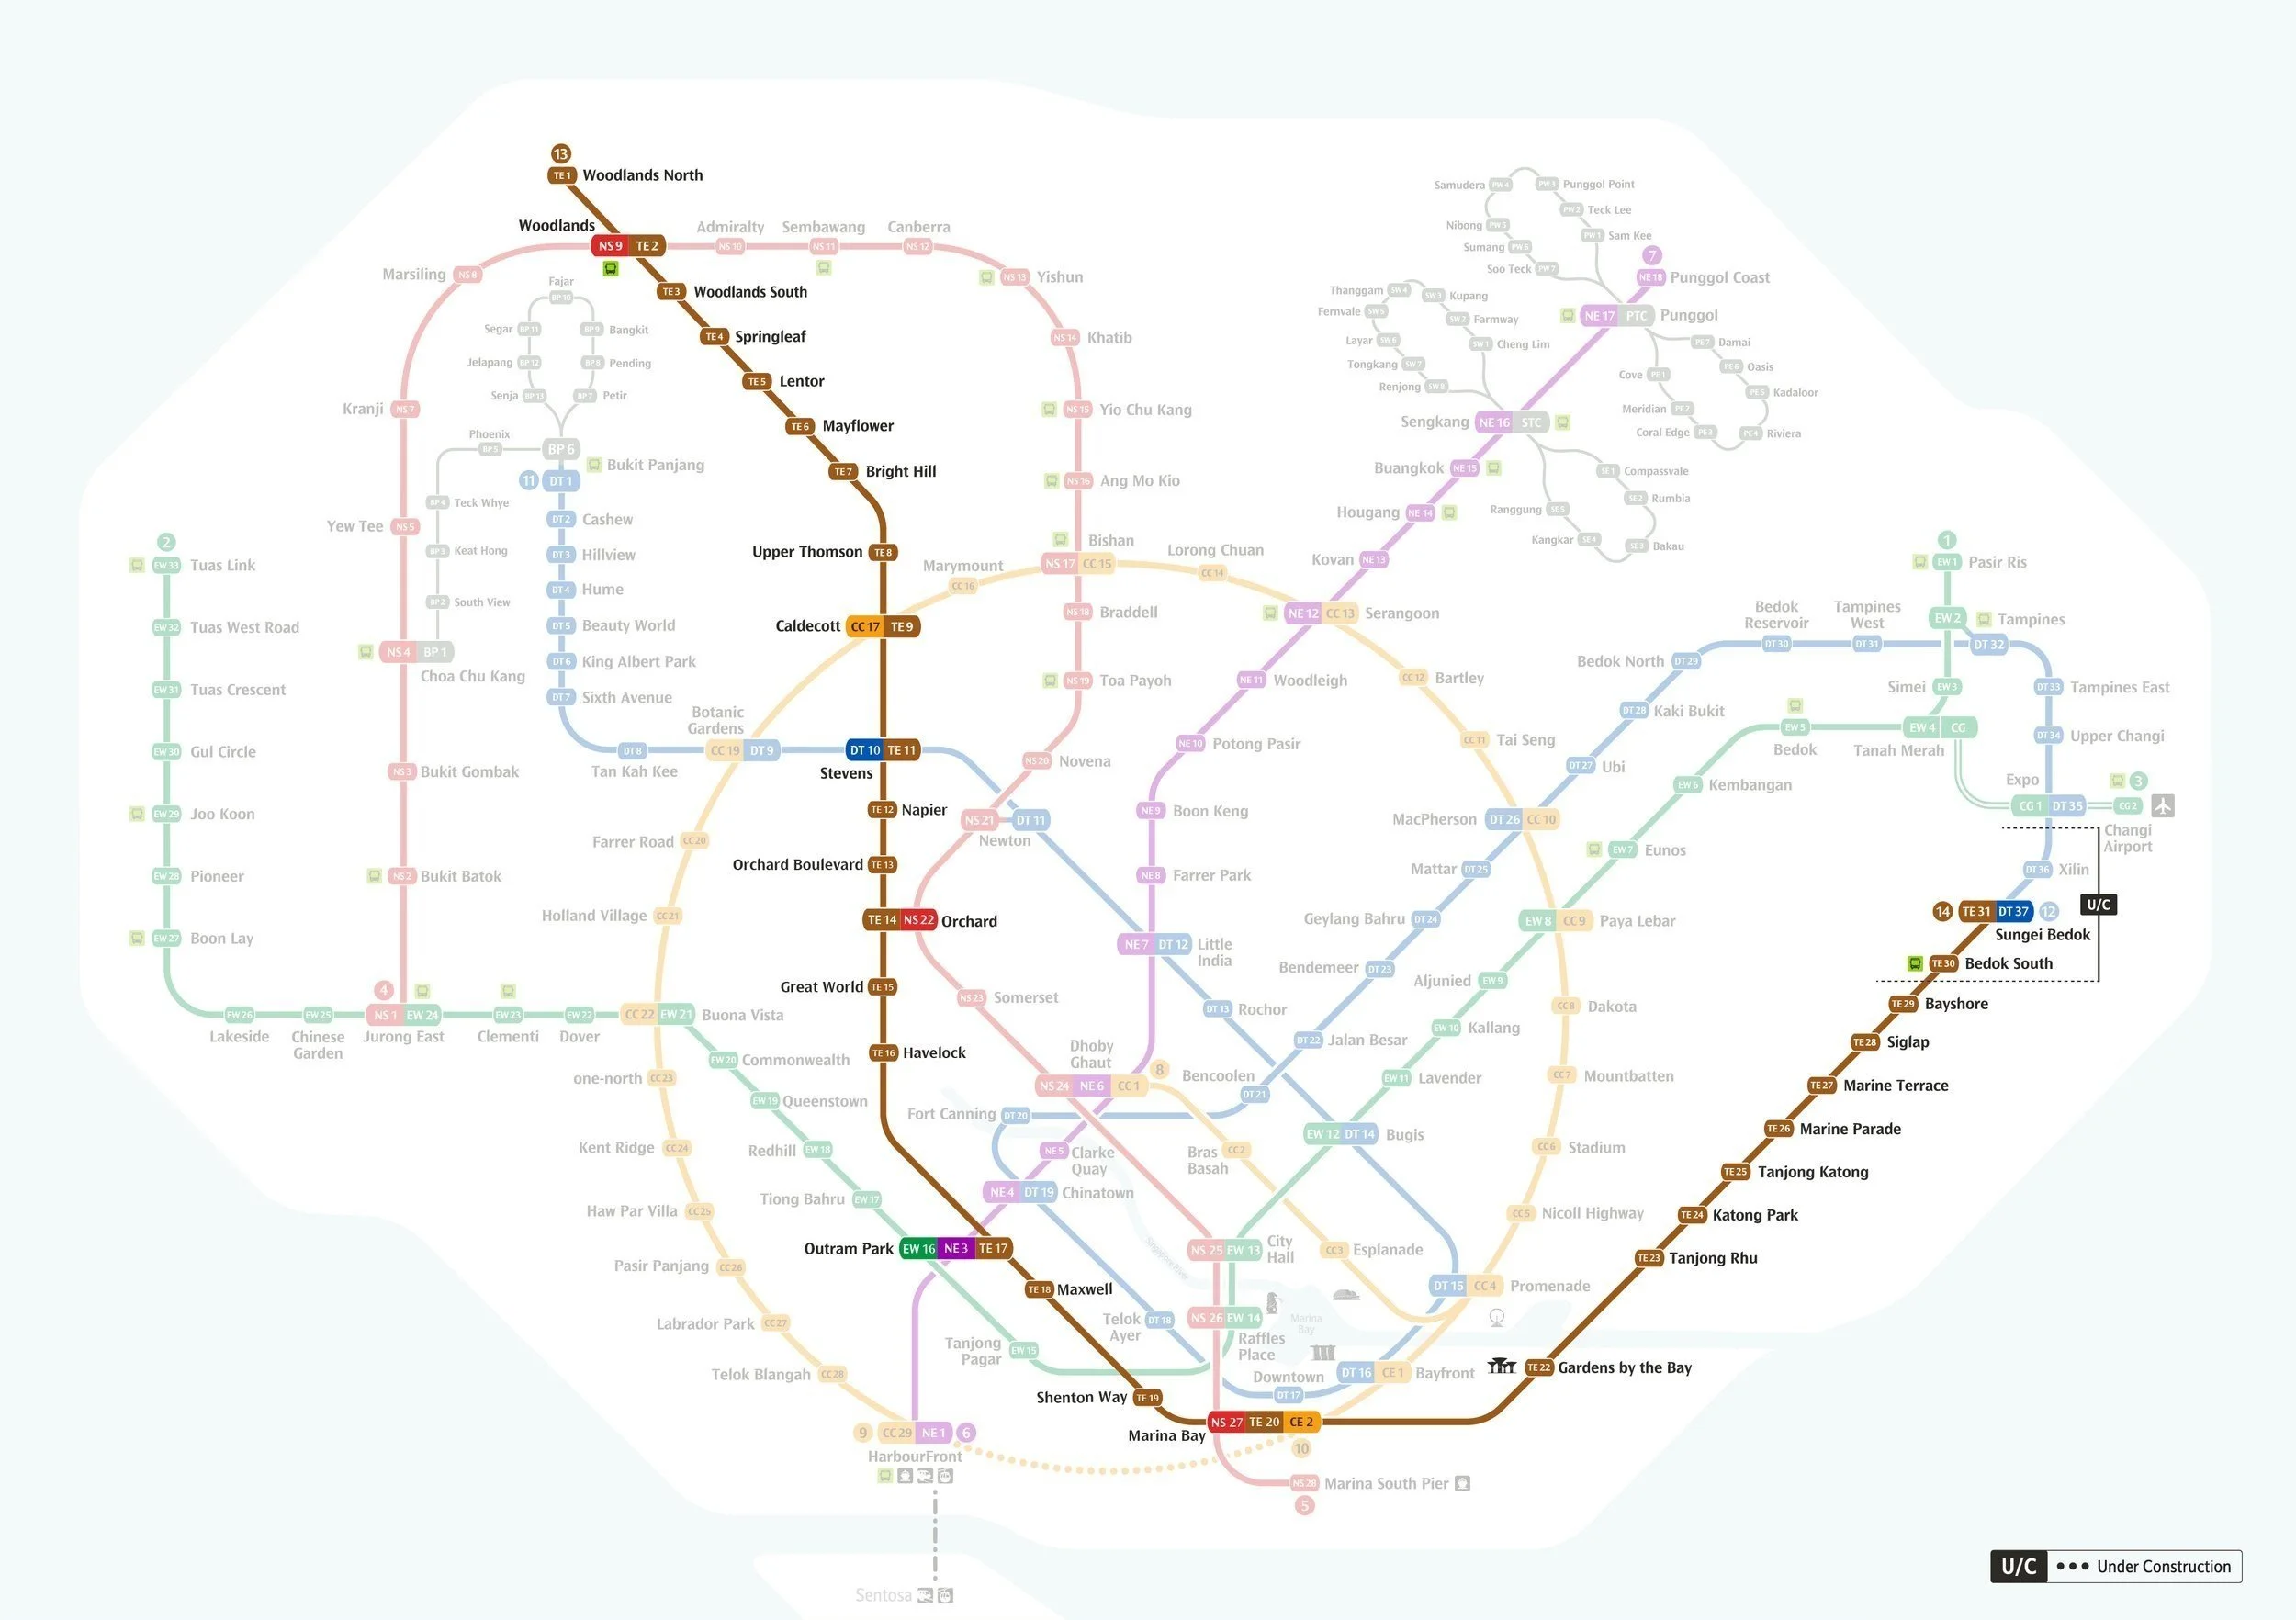
With better layouts, rising income levels, narrowing price gaps, and improved accessibility thanks to MRT expansions like the Thomson-East Coast Line, the CCR is looking more attractive than ever.
For many years, high prices, bad design, and limited accessibility made CCR properties less desirable. But those issues are being addressed. If you’re looking to buy for own-stay or even for long-term value retention, CCR properties may now present some of the best value in the market.
Want a customised assessment of whether the CCR is right for you? Get in touch with us for a tailored deep dive. And stay tuned for our next article on River Valley new launches!
Figure 2: Thomson East Coast Line
10 years ago, the value of 1 Core Central Region (CCR) Property = 2 X Out Of Central Region (OCR) Property. This gap has narrowed to just 30%, and the difference between CCR and Rest of Central Region (RCR) at just 5%. Why is this so?
STL Properties unpacks the Government’s Decentralisation Strategy, Quantum Levels vs Affordability, Problems in CCR and how URA Policies have solved them in recent launches. So sit tight and enjoy our video!
